On June 20 ROSS+associates' replied to an earlier version of this critique with this memorandum.
ROSS+associates' population forecasts for Hall County as presented in Demographic Trends and Development Demand Analysis have the following technical errors:
The primary criticism is that forecasts of a population requires an analysis, at the minimum, of the underlying crude birth, death, and immigration rates. ROSS+associates' use of simplistic function regression on population counts is not a valid technique. Furthermore, a population undergoing significant change, as is Hall County, requires an analysis of the major demographic components found within that population. Ideally, age specific birth, death and immigration rates for each demographic component should be studied.
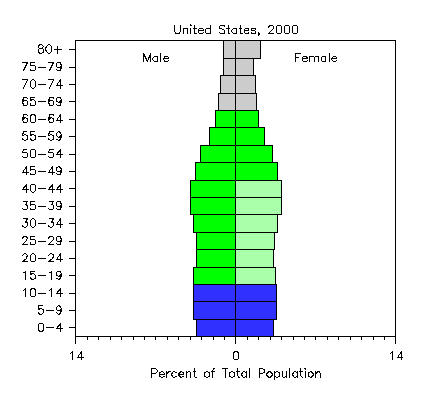
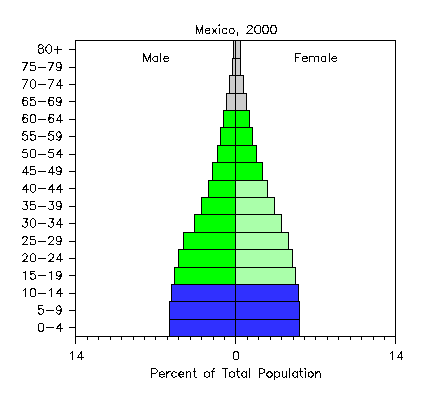
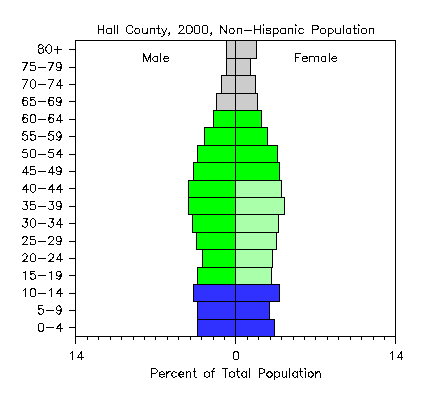
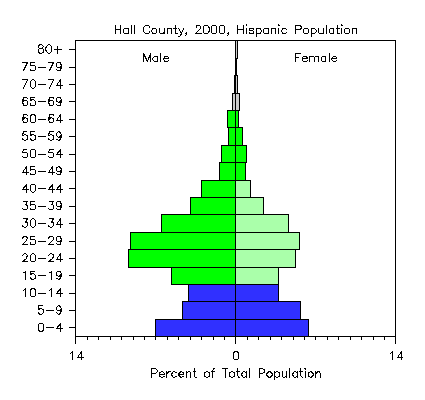
Compare the following population pyramids for the United States, Mexico, and for Hall
County non-Hispanic and Hispanic populations for the year 2000.
(All of the population pyramids generated for the GrowthModels Hall County study can be found
here.)
|
|
|
|
|
|
This is significant in light of the high birth rate found in Mexico and that the majority of Hispanics in Hall County are from Mexico. In 1970 Mexico had the highest birth rate in the world outside of Africa with the average Mexican woman having 6.7 children. Due to a strong government campaign to reduce birth rates, Mexico had reduced their natural rate of increase to 1.8% by 2000. A likely scenario is for Hall County first generation Hispanics to mimic their native cultural's natural growth rate.
ROSS+associates compares Hall County's growth to Gwinett and Cobb Counties.
However, Gwinett and Cobb Counties
primarily reflect growth pressure from metro Atlanta.
Hall County's growth is primarily driven by Hispanic labor immigration.
This difference will be reflected in future patterns of immigration, births, and deaths.
The initial wave of Hispanic immigration was job driven.
Construction boomed in Hall County through the 1990s along with the United States economy.
Poultry jobs opened up as Asians departed.
These construction and poultry industry jobs were filled
by Hispanics immigrating into the county.
Most Hispanics are living in the community where they work.
The Hispanic population pyramid for Hall County 2000 shows a bias of young adult males.
The flow of Hispanic male laborers will taper off if labor jobs are not available.
However, those young adult Hispanic males who have settled in the county
will bring over family members and have children at roughly the same birth rate as is found in their native culture.
It is important to consider the different underlying causes of growth
in Cobb and Gwinett Counties from Hall County
to properly forecast growth in Hall.
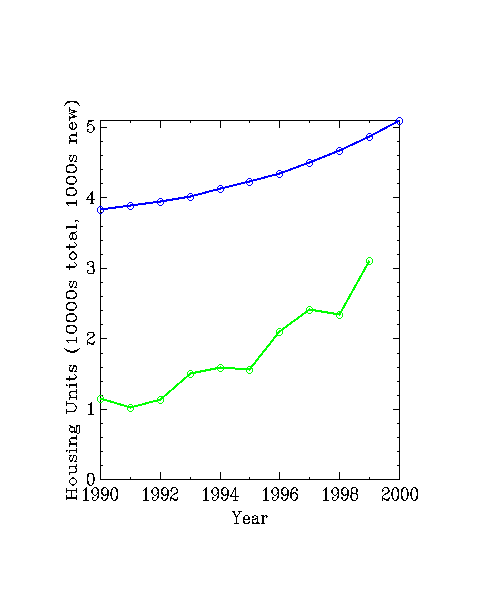
Given that ROSS+associates performed a simplistic function regression
on population time series data, they incorrectly regressed on data
that had already been smoothed by equations for the intercensal years between 1990 and 2000.
This smoothing can be seen in the following graph of
total housing units (10,000s) and
new housing units (1,000s).
 |
Using ROSS+associates' yearly population data for Hall County from 1990 to 2000
a time series was created using The Coca-Cola Company's Interactive Forecasting System.
Of the six functions regressed on ROSS+associates' data the modified exponential function
(y=C0+C1*C2**t) had the best r-squared (goodness of fit) of .999825,
versus .961950 for the linear, and .999115 for the quadratic.
The modified exponential function predicts Hall County population in 2030 with a 90%
confidence interval to be between 3,762,907 and 3,765,376.
By comparison, the linear function predicts Hall County population in 2030
with a 90% confidence interval to be between 243,308 and 279,135.
There are two points to be made.
One is that the artificially smoothed historical data
shows up in the artificially near-perfect r-squared values.
The other is that higher ordered functions are seriously
prone to error when extrapolated out, for instance, thirty years
from ten years of data.
| Function | 2030 Forecast Population | |
|---|---|---|
| Based on 1990-2000 Pop. Estimates | Based on 1990-2003 Pop. Estimates | |
| First order (linear) | 261,222 | 277,661 |
| Second order (parabolic curve) | 603,730 | 476,728 |
| Third order ('ess') | 1,183,570 | -164,463 |
The change in the 'ess' function is more dramatic with the revised forecast for 2030 dropping to a negative population. As noted earlier, "... higher ordered functions are seriously prone to error when extrapolated out, for instance, thirty years ...".
The following table documents the 2001, 2002, and 2003 population estimates used in the
above regressions. These recent population estimates are created using the same
techniques used by ROSS+associates to generate their intercensal estimates for Hall County,
as found in Table P-5 on pg. 7. Notes after the table contain detailed explanations of the data sources.
| Year | 2000 | 2001 | 2002 | 2003 |
|---|---|---|---|---|
| Gainesville and Uninc. Hall Housing Units Permitted | 2191 | 1853 | 2043 | |
| Total Housing Units Permitted | 2121 (see note) | 1824.44 | 2011.51 | |
| Gross Housing Units | 51768 | 53167 | 54465.44 | 55950.95 |
| Discounted Housing Units | 722 | 526 | 526 | 526 |
| Total Housing Units | 51046 | 52641 | 53939.44 | 55424.95 |
| Percent Occupied | 92.8 | 92.8 | 92.8 | 92.8 |
| Number of Households | 47370.69 | 48850.85 | 50055.8 | 51434.36 |
| Persons per Household | 2.89 | 2.91 | 2.93 | 2.94 |
| Population in Households | 136948.66 | 142071.59 | 146433.69 | 151347.93 |
| Pop in Group Households % | 1.68 | 1.68 | 1.68 | 1.69 |
| Pop in Group Households | 2297 | 2387.42 | 2466.04 | 2554.28 |
| Hall County Total | 139245.66 | 144459.01 | 148899.73 | 153902.21 |
| Hall County Total Rounded | 139277 | 144459 | 148900 | 153902 |
This analysis of ROSS+associates omitting recent data in their regressions is not
an endorsement of these techniques to forecast Hall County's population growth.
ROSS+associates' data removes 5,259 housing units between 1991 and 2000 (Table P-5, pg.7). Given that it is rare to remove a housing unit less than 10 years old these 5,259 housing units would have been deleted from the 38,315 housing units stock in place in 1990. By this accounting approximately 14% of Hall County's entire 1990 housing stock was removed by the year 2000.
A more realistic measure of removals comes from the
Gainesville-Hall County Building Inspections Department's data for permits
issued for demolition versus construction of housing units.
Demolition permits were not required until a few years ago
so only data from 2001 and 2002 is used.
Also, there is no guarantee that all removals obtained the proper demolition permits.
As such, these numbers are indicators of the approximate size of the ratio of
additions to removals and not precise numbers.
| Year | 2001 | 2002 |
|---|---|---|
| Housing Units Added | 1853 | 2043 |
| Housing Units Removed | 69 | 68 |
| Ratio Added:Removed | 27:1 | 30:1 |
ROSS+associates ignores the census Hispanic undercount
(see Failure to Include an Estimate of the Hispanic Undercount).
This undercount corresponds to unreported housing units.
ROSS+associates are therefore forced to apply unrealistically steep
discounts to the housing stock
to push the more solid data of building permits down
to underreported census housing stock numbers.
ROSS+associates' population estimates assume that the 2000 census counts are accurate. No mention is made of the Hispanic undercount and no adjustments based on the undercount are made. Doug Bachtel of the University of Georgia estimates the Hispanic population in Hall County in 2000 at 2.5 times the census count of Hispanics. A Hall County apartment owner surveyed the Hispanics in one of his complexes shortly after the 2000 census and noted that only 50% responded, which corresponds to a correction of 2.0. Another undercount estimate based on building permits issued and the average number of Hispanics of Mexican origin per household for the United States as taken from the Census March 2000 Supplement has a 1.25+ correction factor (building permit data is still being collected from some municipalities, hence the '+' sign). Another estimate can be garnered from the average fertility rate in Mexico in 2000 of 9.3% (births per 100 women aged 15 to 44) and the 1,031 Hispanic births 2000 and determining the total Hispanic population from the census 2000 pyramid for that population, which yields a correction of 1.77. Finally, while Census Bureau does not endorse an estimate of the 2000 undercount, their official estimate of the 1990 undercount is 2,257. If we assume that this undercount is composed primarily of Hispanics then the 1990 correction factor for the Hispanic count is 1.5 and it is not unreasonable to use this as another estimate of the correction factor for 2000. Whichever estimate of the undercount is closest to reality, ROSS+associates' failure to acknowledge the Hispanic undercount implies they have not considered the long term effect of cultural differences on growth.
Further discussion of the 2000 Hispanic undercount can
be seen
here.
Errors of fact occur in the following:
While each of these errors taken independent of one another
might not be cause for concern, in aggregate they raise doubts
about the overall veracity and quality of work being presented.
Planning for the future demands good decisions based on reliable information. Gainesville and Hall County have a right to expect legitimate data be provided them by the consultants they have hired. ROSS+associates' forecasts have serious issues that need to be addressed before their data will be of use to Hall County or the City of Gainesville.
June 4, 2003
MetaMedia, Inc.
Heitzso
Nancy G. Harden